


Introduction
Welcome to the ultimate guide on mastering trading chart patterns! In the dynamic world of financial markets, understanding chart patterns is a pivotal skill for any trader seeking success. These visual representations of price movements offer valuable insights into market sentiment and potential future trends. In this comprehensive blog, we will delve deep into the art of recognizing, interpreting, and leveraging various chart patterns. Whether you’re a novice trader looking to build a solid foundation or an experienced investor aiming to refine your skills, join us on this journey to unlock the secrets behind mastering trading chart patterns and enhance your ability to make informed and strategic trading decisions.
In this blog we provides 4 types of trading pattern chart.
BULLISH SYMMETRICAL TRIANGLE
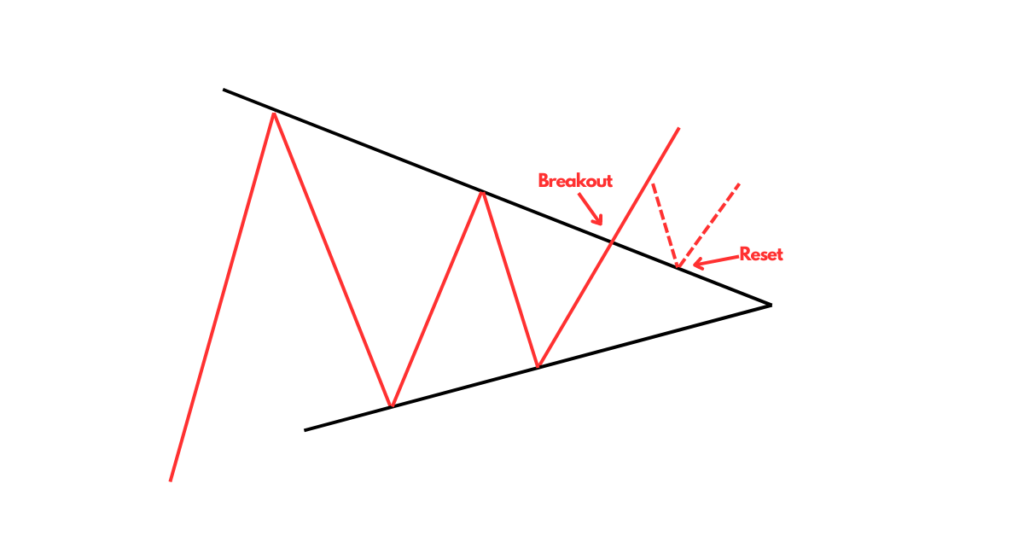
A bullish symmetrical triangle is a bullish
continuation chart pattern. The pattern is
formed by two converging trend lines that are
symmetrical in relation to the horizontal line.
The top line is a bearish trend line creating the
resistance, breakout confirmed once chart
break resistance & goes upward direction
ASCENDING TRIANGLE
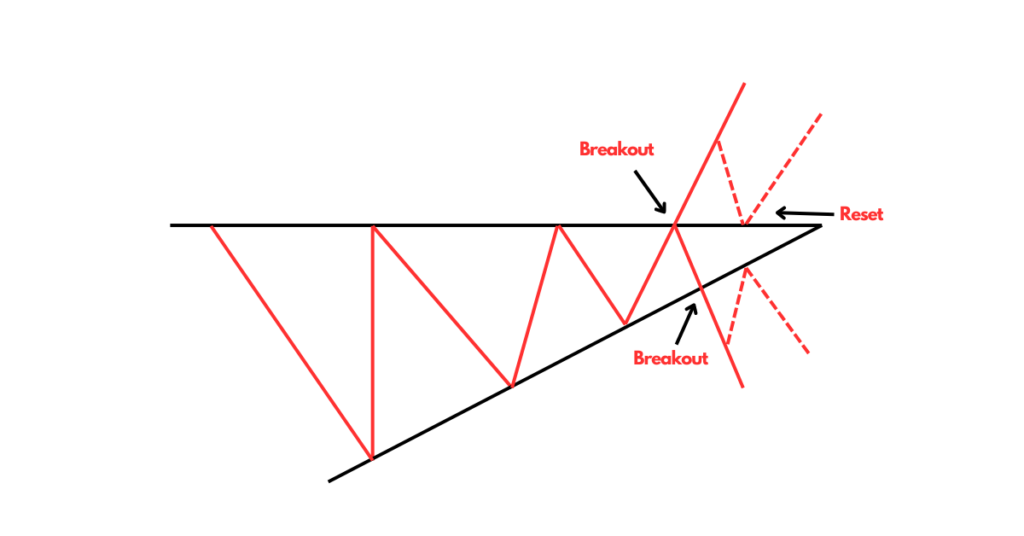
It is formed as a right-angled triangle with a
resistance and a trendline of higher lows,
resistance does not allow the chart to move
more upward, higher lows show that the
buying pressure has increased pattern clearly
indicates that the market moves higher as the
higher lows are formed heading toward the
resistance line. it can break from any direction
TRIPPLE TOP PATTERN
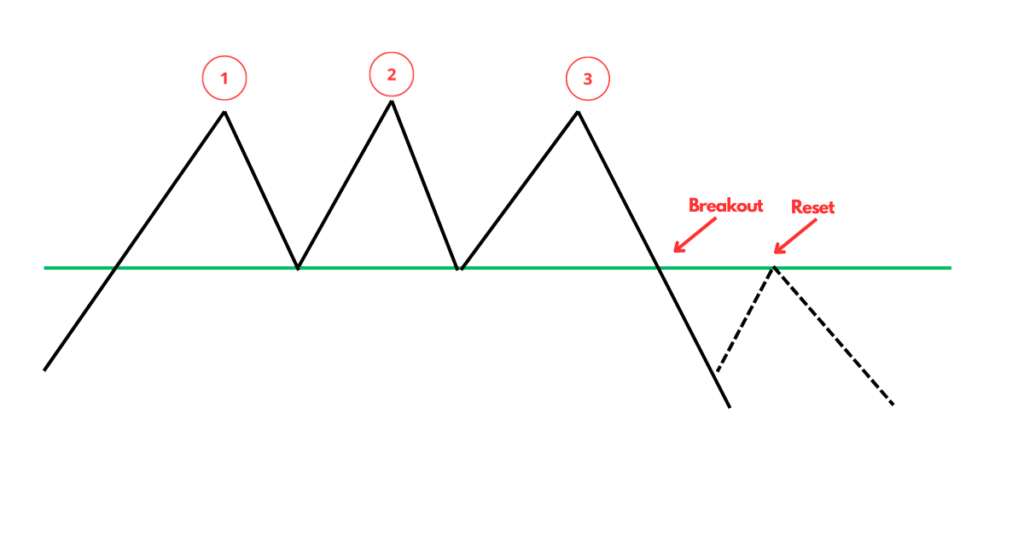
A tripple top is an extremely bearish technical
reversal pattern that forms after an asset
reaches a high price three consecutive times
with a moderate decline between the three
highs. It is confirmed once the asset’s price
falls below a support level equal to the low
between the three prior highs.
CUP & HANDLE PATTERN
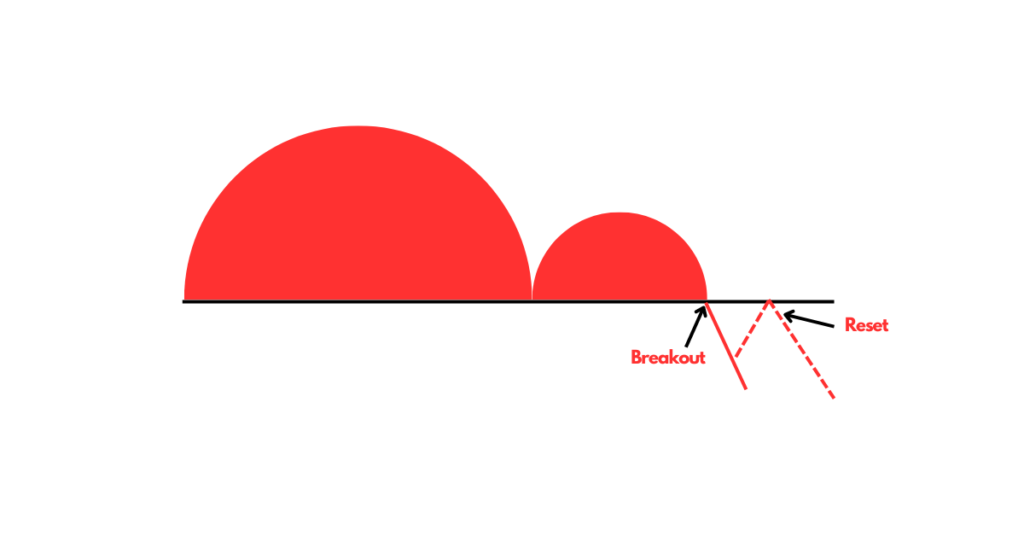
Cup and handle is a technical indicator where
the price movement of a chart resembles a
“tea cup” followed by a downward trending
price pattern. This drop, or “handle” is meant
to signal a buying opportunity to buy a stock,
breakout confirmed once it break neckline /
resistance & goes upward
Conclusion
In this blog BLOGVERCE is given many pattern to learn and grow your portfolio. If our knowledge is usable for you than please it to your friend and family. All pattern are real time knowledgeable for sharemarket.
In this blog we learn all types of pattern to implement in Tradingview and more apps to trading.
FAQs
Referral Link
- https://www.ig.com/en/trading-strategies/10-chart-patterns-every-trader-needs-to-know-190514
- https://www.investopedia.com/articles/technical/112601.asp
- https://www.cmcmarkets.com/en/trading-guides/stock-chart-patterns
- https://optionstrategiesinsider.com/blog/17-stock-chart-patterns-to-look-for-when-analyzing-stocks/
- https://www.forex.com/en/learn-trading/11-chart-patterns-you-should-know/