


Here we share some chart pattern to learn and grow your trading career.
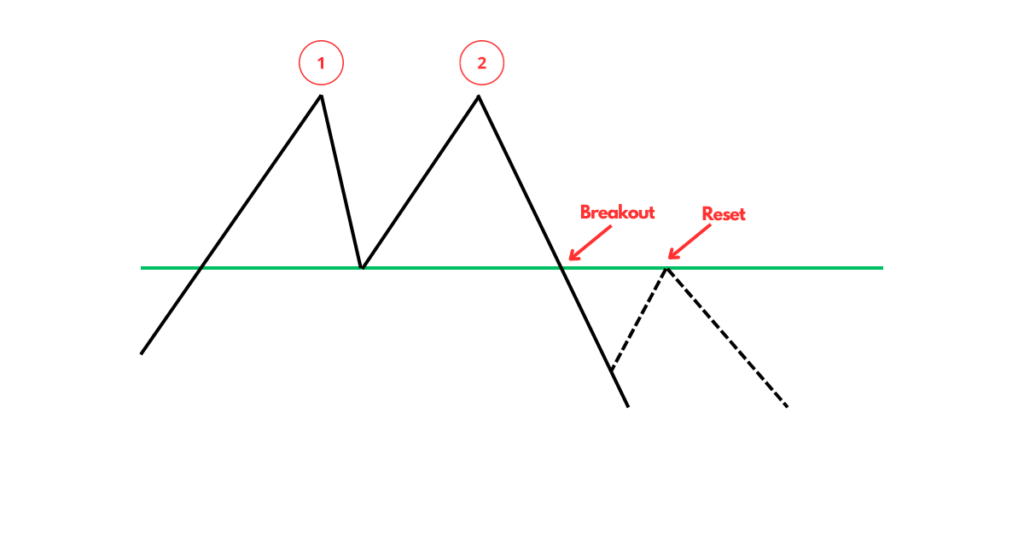
A double top is an extremely bearish specialized
reversal pattern that forms after an asset
reaches a high price two successive times
with a moderate decline between the two
highs. It’s verified once the asset‘s price
falls below a support position equal to the low
between the two previous highs.
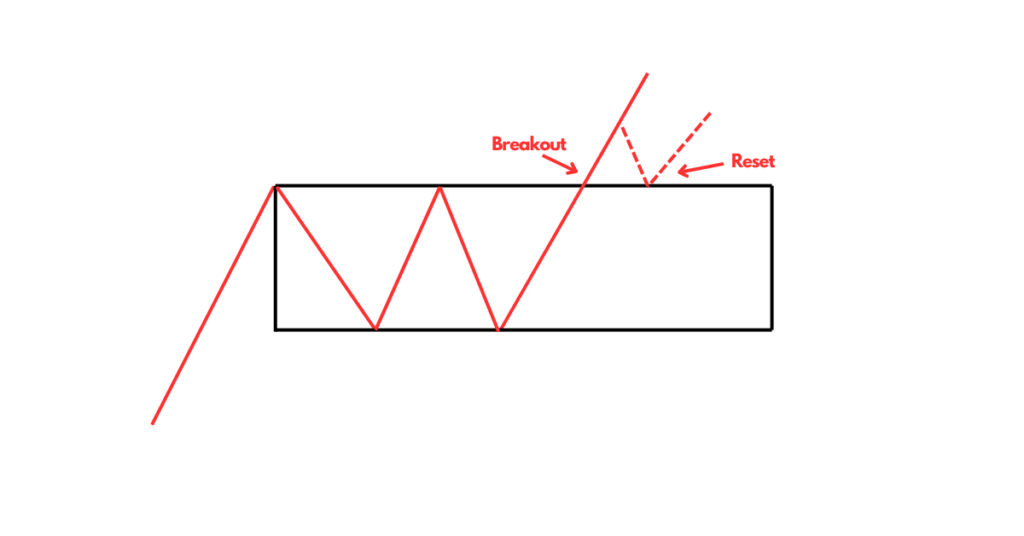
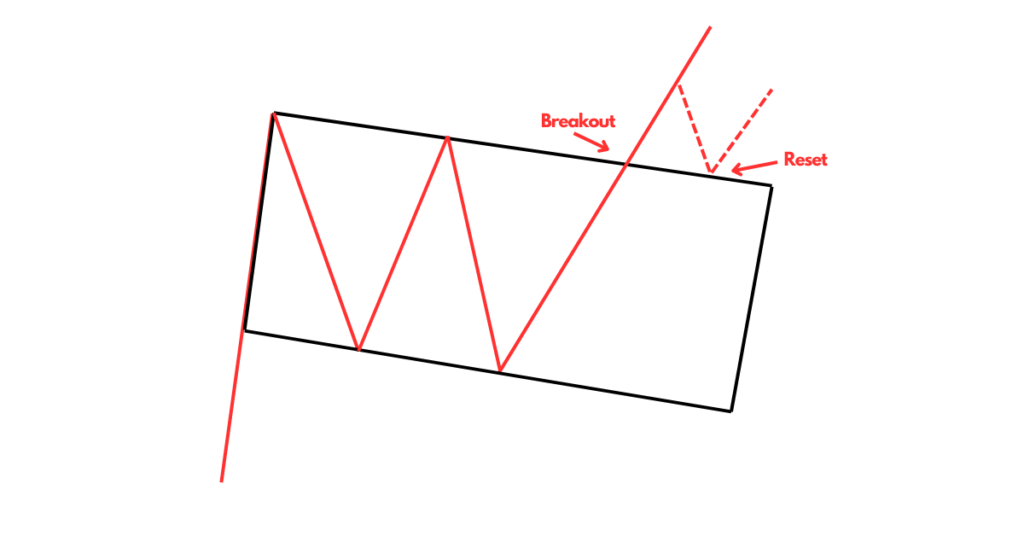
The bullish rectangle is a continuation patterns
that occur when a price pauses during a
strong trend and temporarily bounces
between two parallel levels before the trend
continues, breakout confirmed once it break
its resistance & goes in upward direction
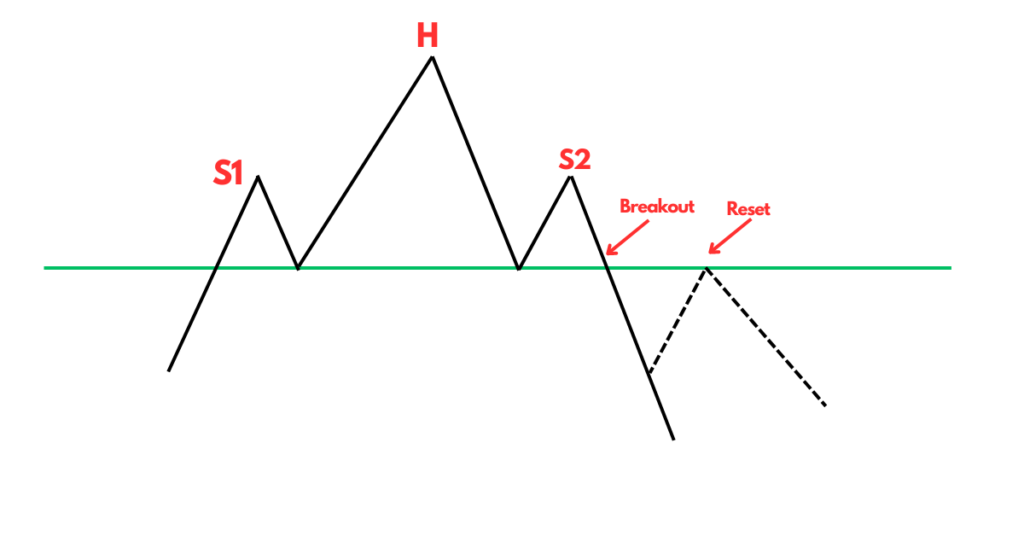
A head & shoulder pattern is a chart formation
that appears as a baseline with three peaks,
where the outside two are similar in height and
the middle is highest & breakout confirmed
once asset breaks support level & it resembles
with human head and shoulder shape thats
why it is called as head & shoulder
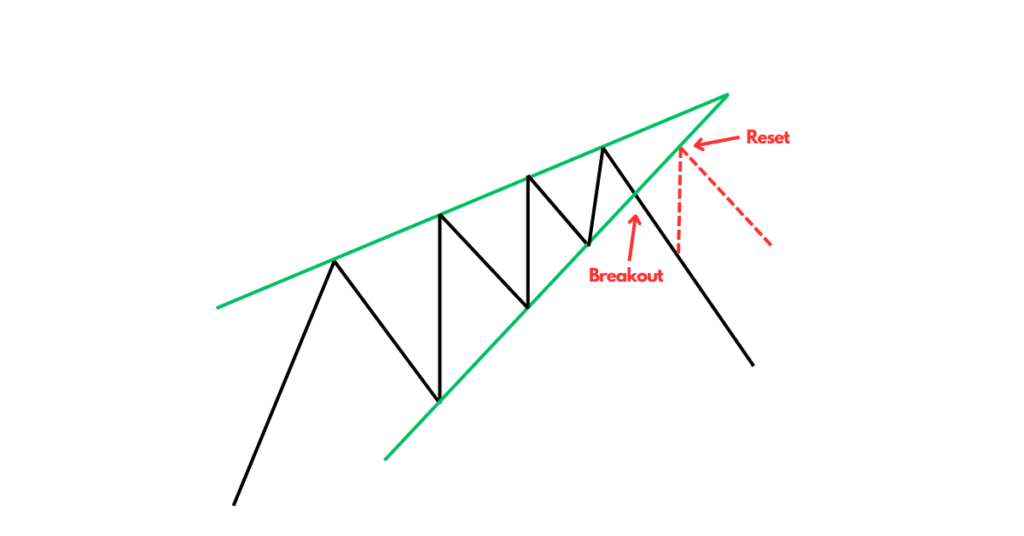
The rising wedge is a technical chart pattern
used to identify possible trend reversals. The
pattern appears as an upward sloping price
chart featuring two converging trendlines. It is
usually accompanied by decreasing trading
volume breakout confirmed once it break
support trendline goes downward
The bullish flag formations are found in stocks
with strong up trends and considered good
continuation patterns. They are called bull
flags because the pattern resembles a flag on
a pole. The pole is the result of a vertical rise in
a chart & the flag results from a period of
consolidation, breakout confirmed once it
breaks from upperside of flag
We have taken all this information from internal and external sources. We do not guarantee that all information is correct. There is a possibility that some information is wrong. We will not be responsible for any wrong information.