


Introduction
The BankNifty(NSE) Candle Chart Pattern is a popular technical analysis tool used by traders to predict future price movements in the Indian banking sector. It is a type of charting method that displays the price movement of a security over a specific time period using candlesticks. By analyzing these patterns, traders can identify potential trend reversals, continuations, and support and resistance levels in the market. Understanding these patterns becomes crucial for traders who wish to create profitable trading strategies. The BankNifty Candle Chart Pattern offers a comprehensive and insightful way to analyze the Indian banking sector, helping traders improve their trading performance and maximize their profits.
We also provide a blog like:-
List of Banknifty chart Pattern
What is a candlestick
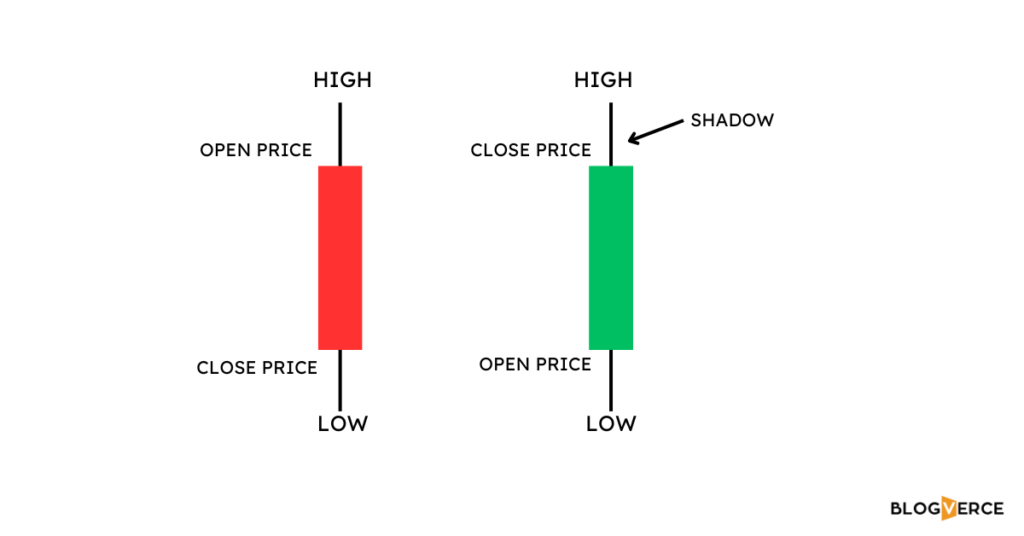
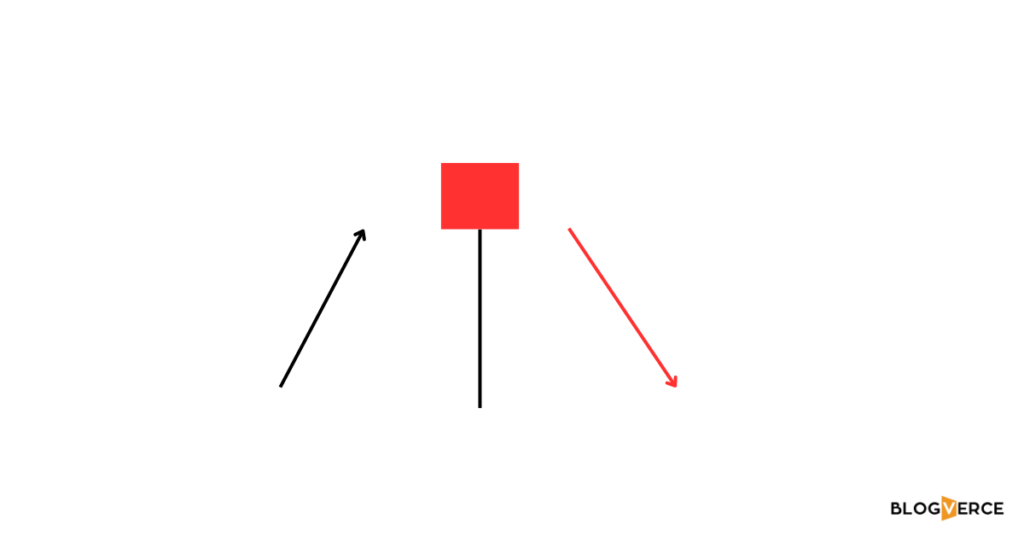
Candlestick shows current mood of market. green candle represent strength / buying & red candle represent weakness / selling rectangle part is called as body & thin line passing through body is called as shadow or wick, upper shadow shows the high price and lower shadow shows low price live during session.
Piercing pattern
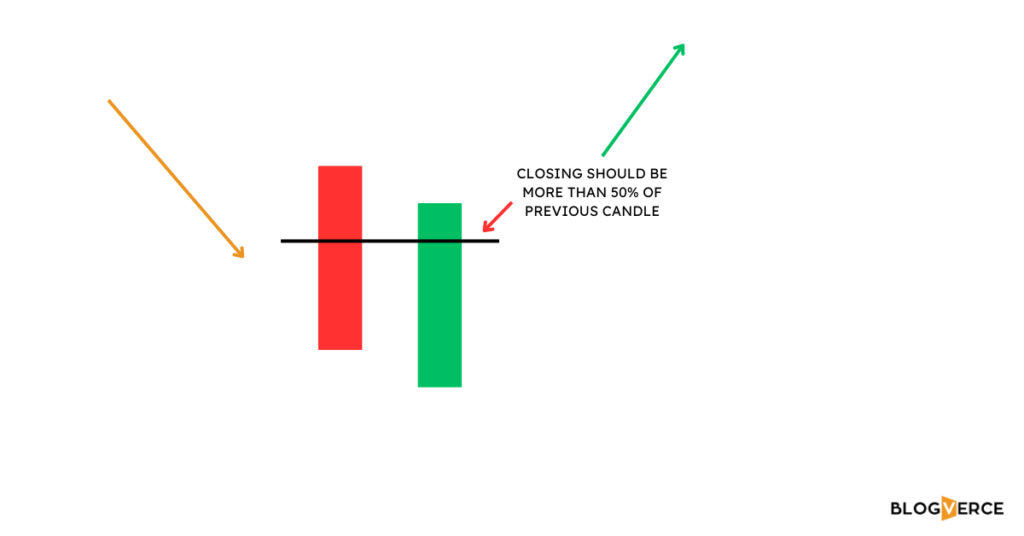
Piercing pattern is a two candlestick chart
pattern which occurs at downtrend indicates
bullish reversal. first candle is bearish then
second candle open as gap down but closes
above 50% of previous candle which simply
means bull market is starting.
THE MORNING STAR
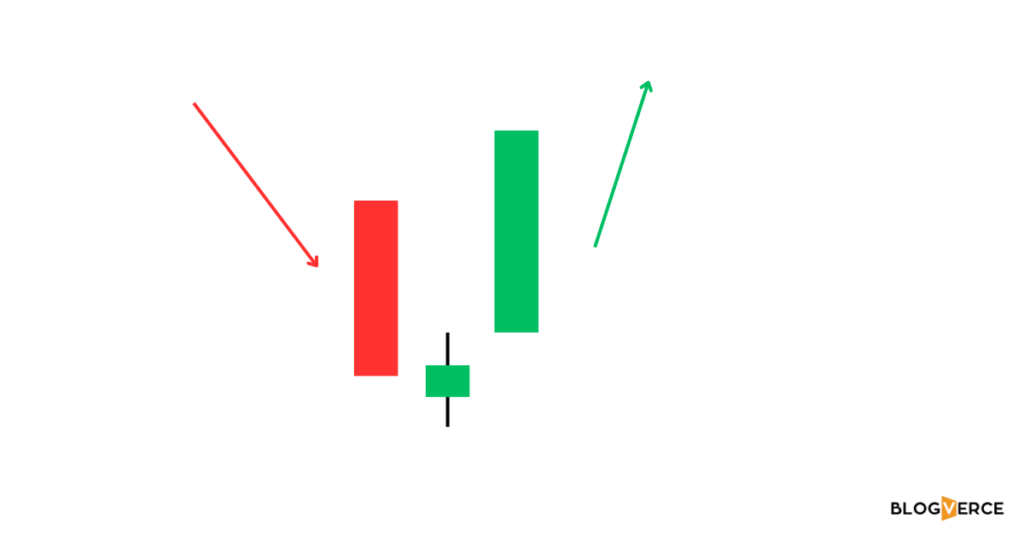
The morning star pattern is a multiple
candlestick chart pattern which occurs at
downtrend, which indicates bullish reversal.
its made of three candle first is bearish,
second is doji means neautral market & third
bullish candle which shows market is ready to
go upward
HAMMER CANDLE
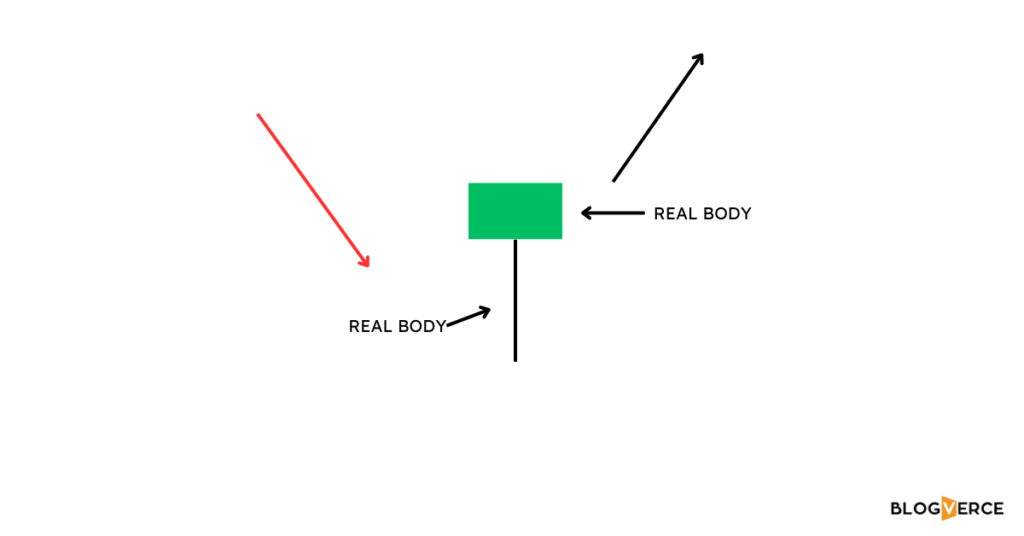
Hammer is single candlestick pattern which
occurs at the end of the downtrend & indicates
bullish reversal. the body of candle situated at
top side with lower shadow which should be
double than the body size. this candle has little
or no upper shadow.
INVERTED HAMMER
Inverted hammer pattern occur at end of
downtrend, which indicates bullish reversal. in
this candle body situated at end / lower side
with big upper shadow, it is inverse of hammer
pattern. shadow should be double thanthe
body of candle.
BULLISH ENGULFING
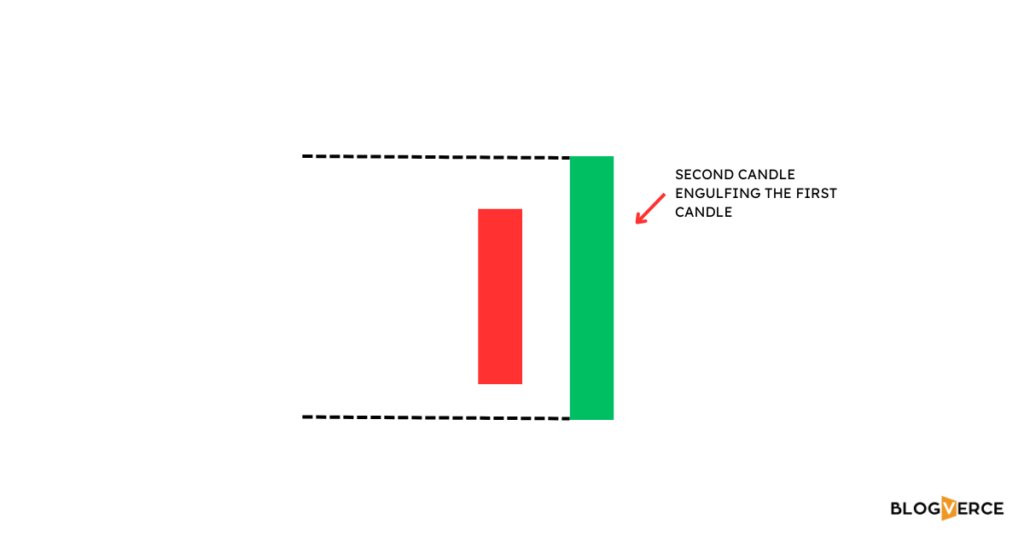
Bullish Engulfing pattern is a two candlestick
chart pattern which occurs at downtrend.
which signals bullish reversal second candle
completely engulfing first candle engulfing
means covering previous candle second candle
is green candle which shows bullish sign.
BULLISH HARAMI
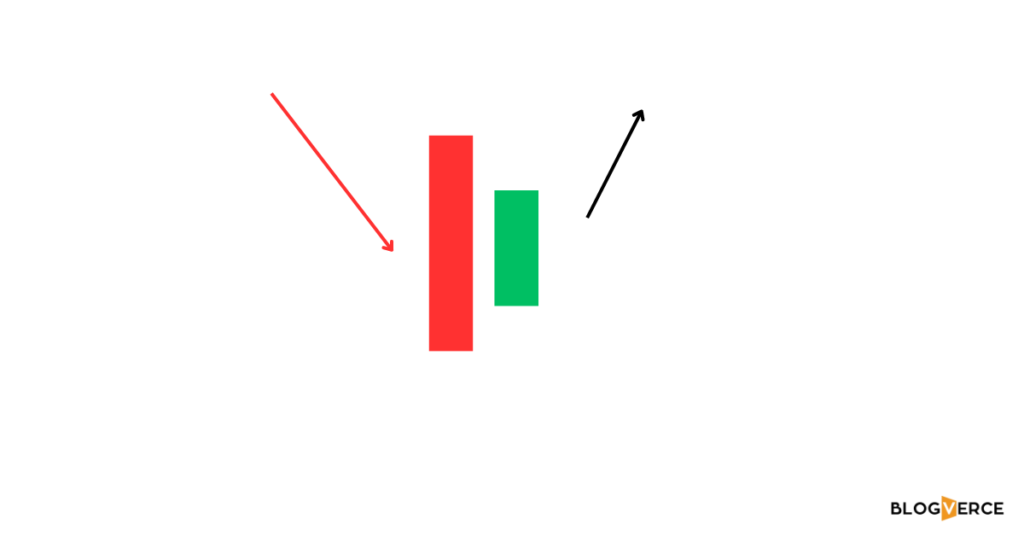
The bullish harami pattern is a two candlestick
chart pattern which occurs at down trend,
which indicates bullish reversal. it consist two
candle first candle is big red candle and then
second is bullish small candle within the range
of previous candle’s body. first candle shows
bearish trend second green candle shows
starting of bullish trend.
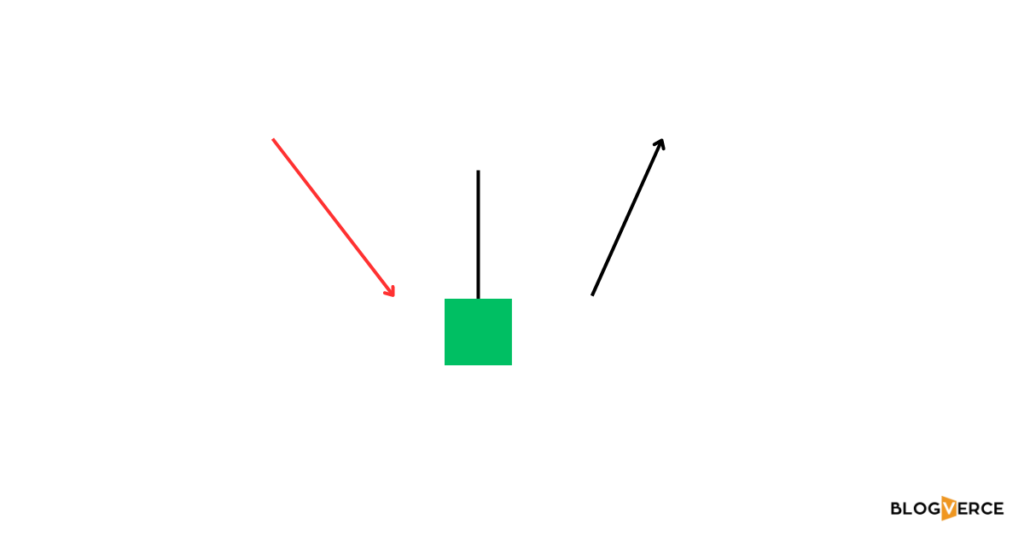
HANGING MAN PATTERN
Hanging man pattern forms at the end of
uptrend, which indicates bearish reversal.
body of candle is located at upside and it has
long lower shadow which should be doubled
the size of body. this candle has no or small
upper shadow it indicates simply market may
fall after this this look like hanging man thats
any it called hanging man pattern.
Conclusion
In conclusion, the BankNifty Candle Chart Pattern is a powerful tool for traders and investors in the Indian banking sector. It enables them to analyze the market trends, identify potential trading opportunities, and make informed decisions based on the market indicators. By understanding the different patterns formed by the candlesticks, traders can predict future price movements, reduce their risk exposure, and maximize their profits. The BankNifty Candle Chart Pattern is a valuable addition to any trader’s toolkit and offers a comprehensive and insightful way to analyze the Indian banking sector.
FAQs
A Candle Chart Pattern in BankNifty is a graphical representation of price movements over a specific time period. It consists of candlesticks that provide information about the opening, closing, high, and low prices during the chosen timeframe. Traders use these patterns to analyze market trends and make informed decisions.
Each candle on the chart represents a specific time interval (e.g., 1 hour, 1 day). The body of the candle indicates the opening and closing prices, while the wicks (or shadows) represent the highest and lowest prices during that period. A green (or white) candle typically signifies a bullish trend, while a red (or black) candle indicates a bearish trend.
Common candlestick patterns include Doji, Hammer, Shooting Star, Engulfing, and Harami. These patterns offer insights into potential market reversals or continuations. Traders often use these patterns alongside other technical indicators for a comprehensive analysis.
Traders use candle chart patterns to identify potential entry and exit points. For example, a bullish engulfing pattern might signal a trend reversal, suggesting a buy opportunity. Conversely, a bearish engulfing pattern may indicate a potential downtrend, prompting traders to consider selling.
While candle chart patterns can be powerful tools, they should be used in conjunction with other technical analysis methods and indicators for a more comprehensive view. Market conditions, news events, and other factors should also be considered when making trading decisions.